I want to show how modern assistants lift debugging in software development. I focus on best AI tools for debugging that catch issues earlier and speed up developer work.
The roundup highlights Qodo, GitHub Copilot, Tabnine, Amazon Q Developer, AskCodi, Replit, Cucumber Studio, Ranorex Studio, Usetrace, and Safurai. I explain how agentic review, test generation, and inline guidance fit into your workflow.
This guide covers context-aware detection, actionable fixes, and integrations that slot into your IDE and CI. I keep each tool section consistent so you can compare code review, test coverage, pros and cons, and best fit.
My goal is practical adoption that boosts productivity without adding complexity. Use this guide to map features to your project and cut debugging time while improving code quality.
Key Takeaways
- I focus on dedicated solutions that reduce errors and speed results.
- Each tool entry keeps the same structure for quick comparison.
- Expect coverage of code review, tests, and IDE plus CI integration.
- Agentic review plus automated tests shorten time to fix issues.
- Look for tools that fit your team workflow and development needs.
Why AI-first debugging matters in modern software development
I’ve seen debugging move from slow guesswork to proactive, context-aware feedback that ships faster. Traditional methods rely on breakpoints and noisy logs that cost time and hide tricky faults.
Modern dedicated tools use ML and NLP to detect anomalies, suggest fixes, and sometimes self-heal in real time. That reduces rework and improves code quality by catching issues earlier in the lifecycle.
These systems learn patterns from tests and repositories. They find subtle errors that manual inspection often misses and link fixes to intent so developers apply changes with confidence.
- Faster feedback in the IDE and CI shortens time to remediate.
- Context-aware agents trim false positives and improve relevance.
- Integration with pipelines enforces secure defaults and flags risky dependencies and secrets.
- They augment developer judgment rather than replace it, preserving control and governance.
| Aspect | Manual approach | Context-aware solutions | CI/CD fit |
|---|---|---|---|
| Detection | Breakpoints, logs | ML-driven anomaly detection | Early pipeline gates |
| Fixes | Developer guesswork | Actionable suggestions tied to code intent | Automated validation |
| Quality & security | Ad hoc reviews | Pattern learning, vuln scanning | Shift-left checks |
How I selected these best AI tools for debugging
I leaned on community feedback and hands-on testing to shortlist solutions that deliver real results. I read developer threads, trialed integrations in active repositories, and measured how each product performed under normal development load.
Signal from developer communities and hands-on testing
I weighed community reports about detection quality and accuracy. Then I ran the tools in real codebases to confirm those claims.
I checked multi-editor support and language coverage so teams can adopt without rewrites. I also tracked onboarding friction and pricing to see how quickly a team reaches first success.
Focus on detection, actionable fixes, and CI/CD fit
I scored each tool on detection precision, the usefulness of suggested fixes, and pipeline compatibility. I validated test generation, PR summaries, and how findings reach developers during reviews.
| Criteria | What I tested | Why it matters | Outcome |
|---|---|---|---|
| Detection | False positives, true positives in repos | Faster triage, fewer distractions | Prefer high precision |
| Actionable fixes | Code snippets, style alignment | Makes fixes safe and consistent | Clear, editable suggestions |
| CI/CD fit | Pipeline tests, PR integration | Shifts checks left, enforces quality | Smooth, low-friction reporting |
| Scalability & governance | Performance under load, RBAC | Secure, team-ready adoption | Works for small teams to enterprises |
1. Qodo: Agentic code review and test coverage to catch bugs early
Qodo ties risk diffing and coverage analysis to PR management so teams spot regressions before they merge. I like that it combines automated review with repository-aware test generation to improve code quality across the development flow.

Overview
Qodo runs agentic checks across commits and PRs. Its Gen agent creates code and tests, Merge summarizes PRs and flags risk, and Aware adds repository data to improve accuracy and reduce noise.
Core features
- Automated PR summaries, /describe and /review commands inside Merge.
- Risk diffing and security scanning during reviews.
- Intelligent test generation and coverage reports for test cases.
- VS Code, JetBrains, terminal, and CI integrations for developer flow.
- SOC 2 compliance with SaaS, on-prem, and air-gapped deployments.
Pros and cons
Pros: stronger PR analysis, faster test creation, governance and management reporting that show measurable results.
Cons: advanced features sit behind paid tiers and teams need time to tune agent workflows for peak accuracy.
Best for
Ideal for teams that need standardized code review, reliable test coverage, and tight data controls across the SDLC. Qodo shortens the path from findings to fixes while keeping developers in their preferred tools.
| Capability | Impact | Deployment |
|---|---|---|
| Agentic review (Merge) | Faster triage of PR risk | SaaS / On-prem / Air-gapped |
| Test generation (Gen) | Improved coverage and fewer regressions | CI integration, IDE plugins |
| Repository-aware (Aware) | Higher suggestion accuracy, less noise | Enterprise reporting and management |
2. GitHub Copilot: Contextual suggestions and inline debugging support
GitHub Copilot shortens the loop between intent and working code with inline completions and an editor chat. I use it to scaffold functions, explain errors, and get quick feedback without leaving my editor.
The extension pairs with VS Code, JetBrains, Neovim, and Visual Studio. It adapts to active files and supports many programming languages, which keeps context tight for developers during normal development work.

Overview
Copilot is a widely adopted coding assistant that generates code suggestions tied to surrounding context. Its inline chat can explain failures and propose fixes while you stay close to the file.
Core features
- Context-aware completions and code suggestions aligned to comments and function intent.
- Editor chat for conversational feedback and inline debugging hints.
- Multi-IDE support and scaffolding for infrastructure and application code.
Pros and cons
Pros: faster prototyping, less boilerplate, smooth workflow with GitHub repos and reviews.
Cons: it can produce duplicate or inefficient code and offers limited test depth in very large codebases. Developers should verify suggestions and run CI checks to avoid regressions.
Best for
Ideal for developers embedded in GitHub who want quick code feedback and inline debugging help. Pair Copilot with CI, snippet managers, and targeted test runs to raise suggestion quality and catch errors early.
| Aspect | Strength | Limit |
|---|---|---|
| Context | Uses local file state | Can miss cross-repo context |
| IDE support | VS Code, JetBrains, Neovim, Visual Studio | Feature parity varies |
| Test help | Explains failures, suggests fixes | Limited deep test generation |
3. Tabnine: Privacy-first AI completions that reduce errors across languages
Tabnine focuses on private, high-quality completions that help developers avoid small but costly errors. I use it when I want suggestions that fit my project style without sending source code to external services.
Overview
Tabnine delivers intelligent completions, refactoring help, linting hints, and auto documentation. It supports many programming languages and common editors, and can run locally or on-prem to meet strict data rules.
Core features
- Context-aware completions that follow project conventions and reduce simple code errors.
- Refactoring suggestions and inline linting to keep code consistent during development.
- Automatic docs and test scaffolding to speed coding and improve maintainability.
- Privacy options: local models or enterprise deployment so team data stays controlled.
Pros and cons
Pros: strong privacy posture, configurable behavior, and solid support across IDEs. It helps boost velocity without changing workflows.
Cons: free tiers limit features and suggestion quality can vary by language.
Best for
Ideal for teams that value data control and consistent completion accuracy across editors and programming languages. I pair Tabnine with CI static checks and test runs to catch remaining issues and harden quality.
| Capability | Benefit | Deployment |
|---|---|---|
| Completions | Faster, consistent code | Local / Cloud / On-prem |
| Refactor & lint | Fewer style errors | IDE plugins |
| Docs & test scaffolding | Improved maintainability | Dev & Enterprise tiers |
4. Amazon Q Developer: AWS-aware coding help with security checks
When I work on cloud projects, a context-aware assistant that knows AWS saves me repeated setup mistakes. Amazon Q Developer ties into IDEs and the AWS Console so I can ask natural language questions and get completions that respect cloud context.
Overview
Amazon Q Developer offers inline prompts and code completions that understand AWS services and APIs. It scans snippets and configuration to flag risky patterns and common security errors while you code.
Core features
- Contextual completions and natural language prompts that generate AWS-aware code snippets.
- Vulnerability detection with quick fixes for insecure configs and credential risks.
- Direct IDE plugins plus access inside the AWS Console to streamline cloud application workflows.
- Limited free tier with monthly interaction caps; paid tiers for heavier usage.
Pros and cons
Pros: strong AWS context, practical suggestions for cloud configuration, and built-in checks that cut time hunting down cloud-specific errors.
Cons: free access is limited, responses can be slower at peak times, and accuracy varies on complex programming tasks.
Best for
I recommend it when you build applications on AWS and want inline support to reduce configuration mistakes. Use it alongside CI security scans and existing debugging workflows so you get both IDE-level help and pipeline enforcement.
| Capability | Value | How it fits a team |
|---|---|---|
| AWS-aware completions | Faster cloud code and fewer misconfigurations | IDE + Console access for tight feedback loops |
| Vulnerability detection | Spot risky patterns early | Pairs with CI scans for full coverage |
| Natural language prompts | Quicker snippets and API usage examples | Helps developers onboard cloud services |
5. AskCodi: Multilanguage assistant for code fixes and issue triage
AskCodi speeds up everyday code fixes by keeping suggestions tied to the file you’re editing. I rely on it when I want quick context-aware feedback that reduces editor hopping and improves pull request clarity.
Overview
AskCodi is a lightweight coding assistant that offers smart completions and targeted debugging suggestions. It supports multiple programming languages and adapts to repository patterns over time to give more relevant insights.
Core features
- Smart code generation that fits local style and common patterns.
- Issue triage that highlights likely root causes and suggests quick fixes.
- Multi-language support across common stacks and test scaffolding to cover edge cases.
- Learning from usage so suggestions align better with team norms and repo conventions.
Pros and cons
Pros: fast help across stacks, less context switching, and clearer suggestions that cut time to resolve issues.
Cons: suggestions can vary in niche domains and should be vetted in complex scenarios.
Best for
I recommend AskCodi to developers who want a low-friction helper for multiple languages. Use it to speed small fixes and triage, but validate key changes with unit test cases to keep confidence high.
| Capability | Value | How to use |
|---|---|---|
| Context-aware completions | Faster edits, fewer typos | Accept and refine suggestions in-editor |
| Issue triage | Quicker PR resolution | Link suggestions to tests and CI checks |
| Learning insights | More relevant suggestions over time | Integrate across branches and review feedback |
6. Replit: Browser-based agent that surfaces bugs while you build
With Replit I open a browser tab and start coding; its agent spots bugs as I type and suggests quick fixes.
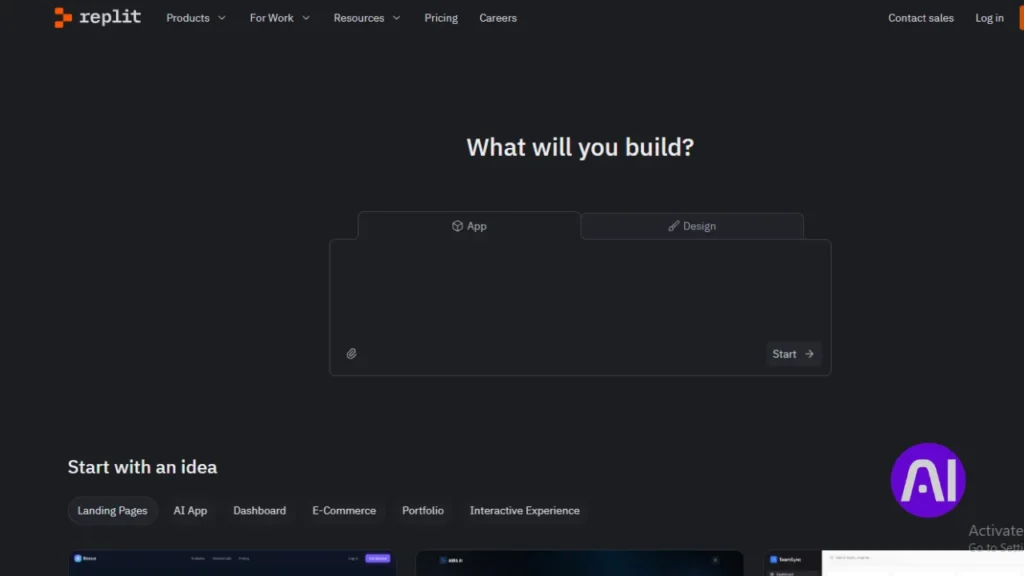
Overview
Replit is a browser-native coding environment that delivers zero-install access to runnable workspaces. The agent offers autocomplete, inline bug detection, and suggested corrections while you edit code.
It accepts prompts and images, and tiers range from free to enterprise. That makes it easy to prototype applications and share reproducible examples with teammates.
Core features
- Zero-install, browser access to a full editor and runtime that reduces setup time.
- Inline assistance: autocomplete, live error hints, and suggested fixes as you type.
- Built-in test helpers and quick iteration loops that speed early validation and results.
- Collaboration and shareable repros that simplify issue reproduction across teams.
- Prompt and image input support to accelerate debugging and prototyping workflows.
Pros and cons
Pros: fast onboarding, immediate feedback during debugging, and clear support for rapid experiments and education.
Cons: editor lock-in can complicate migration, and generated code needs validation for complex cases and production use.
Best for
I recommend Replit for rapid experiments, teaching, and teams that prefer a web-first approach to coding. Use it to reduce friction when reproducing bugs and to get quick test feedback.
Before shifting heavy development, evaluate runtime performance and security posture, and bridge prototypes to local environments or CI when you move to production.
| Feature | Benefit | When to use |
|---|---|---|
| Zero-install access | Fast start, shareable workspaces | Prototyping, demos, classrooms |
| Inline bug detection | Immediate error visibility | Early debugging and small fixes |
| Built-in test helpers | Quicker validation cycles | Early-stage test runs and demos |
7. Ranorex Studio: Cross-platform automated testing to prevent regressions
I rely on Ranorex Studio when I need comprehensive test coverage that reduces manual debugging and prevents costly rollbacks.
Ranorex is a full-featured suite that handles desktop, web, and mobile applications. Its advanced GUI object recognition makes automation resilient in complex interfaces.

Overview
Ranorex combines codeless authoring and code-based options so technical and non-technical contributors can build tests. It integrates with CI/CD to catch issues earlier in the development pipeline.
Core features
- Robust object recognition that stabilizes UI-driven test execution.
- Codeless record-and-play plus advanced code hooks to customize behavior.
- CI integration and detailed reporting to surface failures and prioritize fixes in code.
Pros and cons
Pros include broad application coverage, reliable recognition in complex UIs, and vendor support that helps teams maintain suites.
Cons are higher system requirements and longer runs for large suites compared with lightweight options.
Best for
I recommend Ranorex for organizations that need end-to-end test coverage and centralized management of results. Pair it with unit and integration tests to balance speed and coverage so you reduce post-release hotfixes.
| Capability | Benefit | How it fits |
|---|---|---|
| Cross-platform test | Fewer regressions | CI/CD pipelines |
| Detailed reporting | Better quality oversight | Management dashboards |
| Codeless & code options | Faster test creation | Support for mixed teams |
8. Cucumber Studio: BDD scenarios that expose defects before release
Cucumber Studio turns plain-language behavior into executable checks so teams catch regressions sooner. I use it when I want clear links between requirements, test cases, and code. That clarity helps surface issues before they reach QA or production.

Overview
Cucumber Studio is a behavior-driven development platform that converts human-readable scenarios into automated tests. Stakeholders write scenarios in plain language and developers map them to code. This keeps documentation current and reduces miscommunication during development.
Core features
- Collaborative scenario authoring that creates living documentation aligned to test suites.
- CI/CD integration so test runs provide continuous feedback to developers and the pipeline.
- Scenario-to-code bindings across common programming stacks to keep behavior and implementation linked.
- Integrated debugging output that points to the failing behavior and the related test case.
Pros and cons
Pros: Better team alignment, test cases tied to business logic, and repeatable checks that raise quality. Living documentation reduces drift and keeps stakeholders engaged.
Cons: It adds overhead if teams don’t commit to BDD practices. Teams must learn the scenario style and maintain concise scenarios to avoid brittle suites.
Best for
I recommend Cucumber Studio to cross-functional teams that need a shared language between product and programming. Use it to drive predictable feedback, simplify debugging by narrowing failures to behavior, and keep tests readable for non-developers.
| Feature | Benefit | How it fits development |
|---|---|---|
| Living documentation | Reduces spec drift | Keeps stakeholders and developers aligned |
| Scenario-to-code bindings | Clear trace from test to code | Simplifies debugging of failing behavior |
| CI/CD hooks | Fast feedback on regressions | Automates test runs on every commit |
9. Usetrace: AI-powered web test creation that flags UI and flow issues
Usetrace captures user journeys and turns them into runnable web tests in seconds. I rely on it to automate UI paths so broken flows get flagged before customers encounter them.

Overview
Usetrace is a cloud-based solution that records interactions, generates stable test scripts, and runs them across browsers and devices at scale. It gives visual results that point to the exact step and element causing an issue.
Core features
- AI-powered recording to create tests from real sessions with minimal editing.
- Parallel cross-browser and cross-device execution to speed results and boost accuracy.
- Visual reports that map failing steps to DOM elements and the underlying code paths.
- CI integration so key journeys run on every commit and block regressions early in development.
Pros and cons
Pros include fast authoring, scalable cloud execution, and collaboration support that helps teams prioritize fixes.
Cons are potential cloud latency and the need to manage flaky selectors in dynamic UIs to keep tests reliable.
Best for
I recommend Usetrace for teams with large web footprints that need quick detection of regressions in critical flows. Embed tests into CI, maintain selectors, and map failing runs to tickets so debugging focuses on code-backed steps that matter.
| Capability | Benefit | How to use |
|---|---|---|
| Recording | Fast test creation | Record user session, refine steps |
| Parallel runs | Faster feedback | Run across browsers/devices in CI |
| Visual results | Pinpoint failing steps | Attach screenshots to issues for triage |
10. Safurai: Real-time code analysis with targeted bug suggestions
Safurai gives me live analysis that points out problems in code as I work. It focuses on actionable suggestions and selective automated fixes so I spend less time chasing small errors.
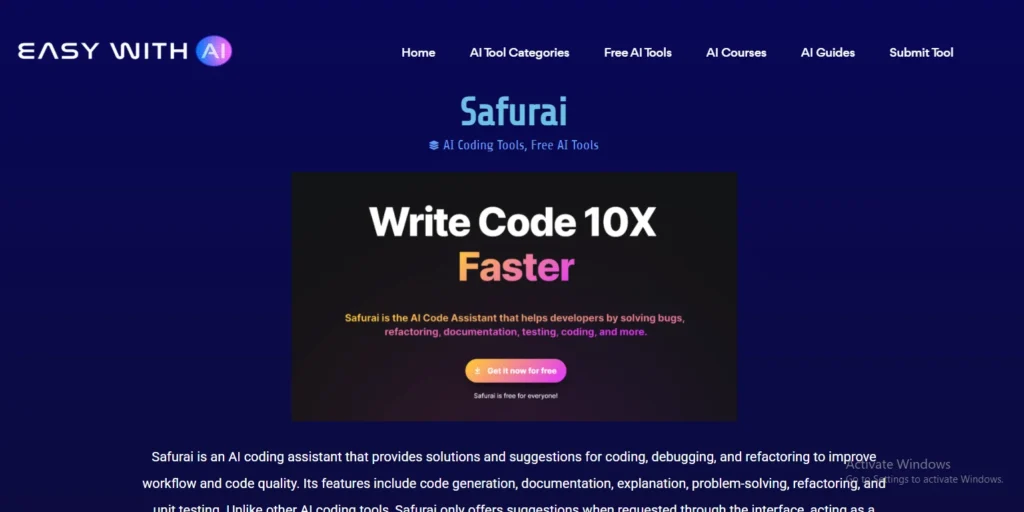
Overview
Safurai runs continuous scans across files and learns from your repository. It surfaces contextual insights, links findings to likely causes, and offers quick fixes that integrate into editors developers already use.
Core features
- Continuous code analysis with in-editor notifications and repository-wide context.
- Context-aware detection that prioritizes real issues and reduces noise.
- Selective automated fixes for routine problems and suggested diffs for complex cases.
- Continuous learning that refines suggestions as the codebase and patterns evolve.
Pros and cons
Pros: faster detection, clearer fixes, and insight generation that helps teams avoid repeating mistakes. Quality improvements compound as suggestions adapt to your repo.
Cons: effectiveness can vary in niche stacks or heavily customized architectures, and teams should validate auto-applied fixes with tests.
Best for
I recommend Safurai to teams that want a lightweight debugging companion. Pair it with static analysis and CI gates to turn its real-time guidance into a reliable safety net that reduces incidents and raises code quality.
Best AI Tools for Debugging: How to choose for your stack and team
I focus on coverage across programming languages and IDEs so the tool becomes part of daily development, not extra work.
Start by mapping language support and editor compatibility. Verify that the tool supports your primary programming languages and the IDEs your developers use every day.
Next, evaluate test generation and code review features. Look for unit test scaffolding, behavior-level test depth, PR summaries, and risk diffing that stop issues before merge.
Check CI/CD integration and access controls. The right integration delivers findings at the correct stage of your workflow without adding friction. Also confirm management, audit trails, and enterprise options such as SOC 2, on-prem, or air-gapped deployments.
Match to language coverage, IDE support, and compliance
- Shortlist based on supported programming languages and editors so daily work stays uninterrupted.
- Verify compliance posture and deployment modes to meet data and access requirements.
- Assess collaboration features like shared annotations and repo-wide insights that speed fixes.
Consider test generation, PR review, and CI/CD integration
- Verify test generation depth from unit scaffolding to behavior tests.
- Confirm PR code review support: summaries, risk diffing, and inline suggestions.
- Run a controlled pilot with representative repositories to validate fit before broad adoption.
| Selection area | What to check | Expected impact | Who benefits |
|---|---|---|---|
| Language & IDE support | List of programming languages; editor plugins | Smoother developer flow, fewer context switches | Developers and teams |
| Code review & PR | PR summaries, risk diffing, inline review | Faster merges, fewer regressions | Reviewers and release managers |
| Test generation | Unit scaffolds, behavior coverage, self-healing options | Less manual test debt, quicker validation | QA and developers |
| Governance & access | SOC 2, on-prem/air-gapped, RBAC, audit logs | Meets compliance, protects sensitive code | Security and management |
Workflow design: Where AI debugging fits in your development process
I map where assistants slot into daily coding so teams get fast, relevant feedback while they work. A clear workflow ties local edits, branch checks, and pipeline gates into a predictable validation loop that protects delivery without slowing developers.
Local coding loops, branch validation, and pipeline gates
Local coding loops surface issues as you type. Editors highlight code smells, suggest fixes, and generate small tests to validate intent. This tightens the feedback cycle and reduces context switching.
Branch validation runs automated tests, PR review agents, and static checks on feature branches. Use these to block risky merges and attach PR summaries so reviewers focus on high-impact changes.
Pipeline gates run broader suites and security scans. Fail fast when quality thresholds drop. Time heavy test runs to nightly or pre-release jobs and keep quick smoke runs in the main pipeline.
| Stage | Primary role | Typical tasks | Outcome |
|---|---|---|---|
| Local | Immediate feedback | Linting, quick unit test, inline fixes | Fewer trivial commits |
| Branch | Validation & review | PR summaries, generated tests, static analysis | Safer merges |
| Pipeline | Enforcement | Full test suites, security scans, behavior checks | Release confidence |
I assign specific tasks by stage: let some tools generate tests, others summarize PRs, and use BDD to keep docs in sync. Tagging findings and tuning gate timing helps teams prioritize fixes that matter to the project and keep debugging focused and efficient.
Security and governance: Balancing speed with safe adoption
Balancing rapid development with strict controls is the core security question I face when choosing deployment modes and governance. I want teams to move fast, but not at the cost of leaking secrets or widening attack surfaces.
On-prem, air-gapped, and data protection options
Pick a deployment that matches your system rules and regulatory needs. SaaS gives speed and support, on-prem gives control, and air-gapped setups isolate sensitive repositories.
Role-based access and logging keep management informed without slowing development. Limit who can run model inference on private code and require approved model lists to reduce unexpected training on proprietary data.
- Scan code for secrets, risky dependencies, and misconfigurations to cut security via errors early.
- Segment environments and restrict contractor access to reduce exposure.
- Test features in lower environments before broad rollout and record audit logs for incident response.
| Mode | Control | Speed | Best fit |
|---|---|---|---|
| SaaS | Moderate (SOC 2 options) | High | Teams needing rapid support and upgrades |
| On‑prem | High (full data control) | Medium | Regulated software environments |
| Air‑gapped | Very high (isolated) | Low | Top-secret repos and strict compliance |
Pricing and scalability: Planning for individual, team, and enterprise needs
My first step is to map expected usage—editor seats, pipeline minutes, and parallel test runs, against subscription tiers. That shows where free plans work and when paid seats add critical features like PR review or test generation.
I compare vendor models: Qodo offers developer credits, team pricing, and enterprise on‑prem or air‑gapped deployments. GitHub Copilot and Tabnine use tiered plans, Replit has free and paid tiers, and Amazon Q Developer limits free monthly caps. Those limits matter as your project grows.
Forecast costs by tracking active developers and heavy tasks such as parallel tests. Watch overage policies and pipeline minute billing to avoid surprises during peak time.
- Start small: run a pilot with a handful of developers to validate output and results before scaling seats.
- Measure ROI: fewer incidents, less rework, and faster lead time to change justify subscription spend.
- When you need SSO, audit logs, or advanced deployment, move to enterprise plans for compliance.
| Tier | When to upgrade | Impact |
|---|---|---|
| Free / Credits | Exploration, small projects | Low cost, limited parallel runs |
| Team | Regular usage by multiple developers | Better CI minutes, shared seats |
| Enterprise | Regulated software, heavy pipelines | SSO, audit logs, on‑prem or air‑gapped |
Conclusion
I suggest a pragmatic path: shortlist a couple of focused code solutions and run a short pilot on a real branch. This proves how detection plus clear, actionable fixes cut time spent on debugging.
Match choices to your team. IDE assistants speed edits, automated testing stops regressions, and BDD keeps behavior aligned to requirements. I weigh governance and deployment options like SOC 2 or on‑prem when the case needs stricter controls.
Tune workflows so feedback appears where developers work. That reduces context switching, surfaces real problems early, and raises long‑term quality as tests and reviews mature.
Start small this week: pick one or two tools, apply them to a branch, measure results, and revisit the stack quarterly to keep your development flow efficient.
FAQ
What role do context-aware suggestions play in speeding up bug fixes?
Context-aware suggestions reduce guesswork by analyzing surrounding code, tests, and commit history to propose targeted fixes. I find they cut debugging time because the recommendations often include the exact line changes or test cases needed to validate the repair, improving accuracy and developer productivity.
How do I choose a solution that fits my language stack and IDE?
I match tools to the languages my team uses, the IDEs we prefer, and our CI/CD setup. I also weigh test generation, pull request review support, and whether the tool integrates with GitHub, GitLab, or Azure DevOps. Prioritizing extensions and plugins that work in the editor my team uses prevents workflow friction.
Can these agents generate reliable tests and regression suites?
Yes, several platforms can create unit and integration tests automatically, and some generate BDD scenarios or UI tests. I always review and run generated tests locally before merging, since automated tests speed coverage but rarely replace a human review for edge cases and complex logic.
Are there privacy or compliance concerns when using cloud-based code assistants?
Absolutely. I check data handling policies, options for on-prem or air-gapped deployments, and whether the vendor supports enterprise data protection. For regulated projects, I prefer solutions that guarantee no persistent code retention and offer fine-grained access controls.
How well do these tools handle security and vulnerability detection?
Many tools include security scans and dependency checks that flag known vulnerabilities and unsafe patterns. I treat their findings as a first-pass triage: they accelerate detection, but I validate critical security fixes through dedicated SAST/DAST tools and security reviews.
Will integrating an agentic code reviewer disrupt my CI/CD pipelines?
Integration varies by tool, but most provide plugins or CI steps that slot into existing pipelines. I start with a non-blocking mode to collect feedback, then enforce gates once the signal-to-noise ratio looks good. That staged approach minimizes disruptions while improving quality over time.
How can teams measure ROI after adopting these debugging assistants?
I track metrics like time-to-fix, number of reopenings, PR review time, and regression incidents. Pairing those with developer satisfaction surveys and throughput helps quantify productivity gains. Incremental metrics collected over sprints show whether the tool reduces overall cycle time.
Do these platforms support multilingual codebases and polyglot projects?
Many support a broad range of popular languages and frameworks, but depth varies. I evaluate support for primary languages first, then test mixed repositories. For polyglot teams, I prefer vendors that document language-specific behavior and provide consistent results across runtimes.
What’s the best way to adopt a tool across a distributed team?
I roll out gradually: pilot with a small group to tune rules and integrations, create documentation for common workflows, and run training sessions. I also set clear expectations about when to trust suggestions and how to file feedback with the vendor to improve outputs.
How do these assistants help with code reviews and PR hygiene?
They automate routine checks, suggest refactors, and point out failing tests or style issues directly in PRs. I use them to catch low-value review comments, freeing reviewers to focus on design, architecture, and complex logic decisions.
Can generated fixes introduce new bugs or regressions?
They can, which is why I never accept automated fixes without running CI, tests, and a quick human review. I treat suggestions as a draft that speeds the fix, not a drop-in replacement for verification and contextual judgment.
What licensing or pricing factors should I consider when scaling to an enterprise?
I look for flexible plans that support seat-based scaling, org-level features like SSO and audit logs, and predictable overage costs. It’s important to evaluate whether advanced features—on-prem deployment, compliance certifications, or enhanced privacy—carry additional fees.
How do these solutions integrate with issue tracking and incident workflows?
Most tools can create tickets, attach diagnostics, or link findings to JIRA, GitHub Issues, or other trackers. I configure automated triage so critical failures generate alerts and context-rich bug reports, reducing time from detection to assignment.
Are offline or air-gapped deployment options available for sensitive projects?
Some vendors offer on-prem or air-gapped installations that keep code and telemetry internal. I confirm deployment models, required infrastructure, and update procedures before selecting a solution for sensitive or regulated work.
How do I ensure suggestions align with our coding standards and conventions?
I feed the tool our linters, config files, and style guides, and I tune rules during the pilot. Many platforms let you customize suggestions or whitelist project-specific patterns so recommendations match team conventions.
What role does human feedback play in improving tool accuracy?
Human feedback is essential. I encourage developers to accept, modify, or reject suggestions and to report false positives. That feedback loop helps the vendor refine models and adapt the tool to our codebase over time.
How quickly can a small team start seeing value from these assistants?
You can see immediate wins in reduced typos, better completions, and faster triage. For measurable improvements in cycle time and fewer regressions, expect a few sprints while rules and integrations settle. I recommend tracking early metrics to validate impact.